맥킨지 매트릭스(McKinsey Matrix)는 기업 전략과 투자 결정을 돕기 위해 사업 포트폴리오를 평가하는 도구입니다. 맡킨지(McKinsey & Company)의 컨설팅팀에서 개발한 이 매트릭스는 GE/McKinsey 포트폴리오 분석 모델이라고도 불리며, 사업 단위별로 시장의 매력도와 사업 단위의 경쟁력을 평가하여 자원을 효율적으로 배분하고, 전략적 결정을 내리기 위해 사용됩니다.
1. 맥킨지 매트릭스의 개념
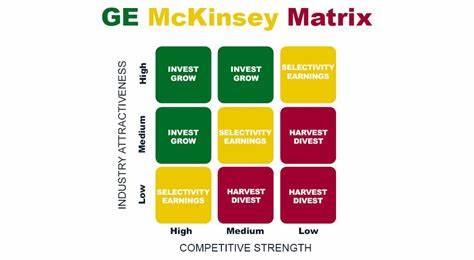
맥킨지 매트릭스는 **9개의 셀(3x3 격자 형태)**로 구성된 2차원 매트릭스입니다. 각 축은 다음과 같습니다:
- 시장 매력도(Market Attractiveness): 해당 사업이 속한 시장의 매력도를 평가하는 축입니다. 이 축은 시장 성장률, 시장 규모, 경쟁 강도, 규제 환경 등 다양한 요소를 포함할 수 있습니다.
- 사업 단위의 경쟁력(Competitive Strength): 각 사업 부문이 경쟁 시장에서 얼마나 강한 경쟁력을 가지고 있는지를 평가하는 축입니다. 이는 시장 점유율, 제품 차별화, 브랜드 이미지, 기술력 등을 포함한 경쟁 우위 요소로 측정됩니다.
2. 맥킨지 매트릭스의 9가지 영역
맥킨지 매트릭스는 3x3 격자로 나누어지며, 각 격자는 다음과 같은 의미를 가집니다:
(1) 높은 시장 매력도 & 높은 경쟁력 (상위 오른쪽 영역)
이 영역에 속하는 사업 부문은 유망하고 경쟁력이 강한 분야입니다. 여기서 중요한 전략은 성장 전략으로, 시장에서의 입지를 확장하고 더 많은 자원을 투자하여 성장을 지속하는 것이 바람직합니다.
- 전략: 확장 전략(Invest/Expand)
- 예: 시장에서 주도적인 경쟁력을 가진 제품이나 서비스를 운영하는 사업 부문.
(2) 높은 시장 매력도 & 낮은 경쟁력 (상위 중앙 영역)
이 영역은 시장 매력도는 높지만 경쟁력이 낮은 사업 부문입니다. 이러한 사업은 성장 잠재력은 있지만, 경쟁력이 부족하여 자원의 효율적인 배분이 필요합니다. 일반적으로 경쟁력 향상을 위한 전략을 취해야 합니다.
- 전략: 전략적 개선 및 투자(Invest to improve)
- 예: 유망한 시장에 진입했지만 아직 시장 점유율이 낮거나 브랜드 인식이 부족한 제품군.
(3) 높은 시장 매력도 & 매우 낮은 경쟁력 (상위 왼쪽 영역)
이 영역에 속하는 사업 부문은 매력적인 시장에 있지만, 경쟁력이 거의 없는 상태입니다. 이 경우, 사업 철수나 리소스 재배치가 필요할 수 있습니다.
- 전략: 철수하거나 다른 방안을 고려(Divest/Exit)
- 예: 시장 성장성은 있지만, 경쟁에서 뒤처진 사업 부문.
(4) 중간 시장 매력도 & 높은 경쟁력 (중앙 오른쪽 영역)
이 사업 부문은 경쟁력은 있지만 시장 성장성이 떨어지는 상황입니다. 이런 경우 수익 극대화가 목표가 될 수 있으며, 비용 절감과 효율성 증대가 주요 전략이 될 수 있습니다.
- 전략: 수익 최적화(Harvest/Optimize)
- 예: 안정적인 시장에서 경쟁력을 유지하고 있는 사업 부문.
(5) 중간 시장 매력도 & 중간 경쟁력 (중앙 중앙 영역)
이 영역의 사업 부문은 상당한 성장 가능성이 없고 경쟁력도 평균 수준입니다. 리소스 배분을 신중하게 해야 하며, 경쟁력을 높이거나 시장을 떠나는 결정을 내릴 수 있습니다.
- 전략: 유지 혹은 재조정(Maintain or Improve)
- 예: 성장 잠재력이 낮은 시장에 존재하는 보통의 경쟁력을 가진 사업 부문.
(6) 중간 시장 매력도 & 낮은 경쟁력 (중앙 왼쪽 영역)
이 사업 부문은 시장 성장성이 떨어지며, 경쟁력도 낮습니다. 이 경우, 리소스 재배치나 사업 철수가 필요할 수 있습니다.
- 전략: 사업 축소 혹은 철수(Divest/Exit)
- 예: 경쟁에서 뒤쳐진 제품군이나 서비스를 가진 사업 부문.
(7) 낮은 시장 매력도 & 높은 경쟁력 (하위 오른쪽 영역)
이 영역에 속하는 사업 부문은 시장의 매력도는 낮지만, 경쟁력은 상대적으로 높습니다. 수익을 극대화할 수 있는 전략이 필요하며, 이 사업 부문은 안정적인 수익을 추구하는 것이 중요합니다.
- 전략: 수익 최적화(Harvest)
- 예: 성숙기 시장에서 강력한 경쟁력을 가진 제품이나 서비스.
(8) 낮은 시장 매력도 & 중간 경쟁력 (하위 중앙 영역)
이 사업 부문은 매력적인 시장이 아니며 경쟁력도 중간 수준입니다. 이 경우, 리소스를 적극적으로 투자하기보다는 점진적인 축소나 사업 전략 재조정이 필요할 수 있습니다.
- 전략: 유지 혹은 축소(Maintain or Reduce)
- 예: 성장성이 낮은 시장에 존재하는 평균적인 경쟁력을 가진 사업 부문.
(9) 낮은 시장 매력도 & 낮은 경쟁력 (하위 왼쪽 영역)
이 영역에 속하는 사업 부문은 시장 매력도도 낮고, 경쟁력도 낮은 상태입니다. 일반적으로 사업 철수나 자원 재배치가 필요합니다.
- 전략: 사업 철수(Divest/Exit)
- 예: 수익을 창출할 가능성이 낮은 사업 부문.
3. 맥킨지 매트릭스의 활용
맥킨지 매트릭스는 기업이 사업 포트폴리오를 평가하고 자원 배분 전략을 결정하는 데 유용한 도구입니다. 이를 통해 조직은 시장 성장 가능성과 경쟁력을 고려하여 전략적 결정을 내릴 수 있습니다.
- 자원 배분: 기업은 매트릭스를 사용하여 각 사업 부문에 대한 자원 배분 우선순위를 정할 수 있습니다.
- 경쟁력 분석: 기업은 자사의 경쟁력을 객관적으로 평가하고 강점을 강화하거나 약점을 개선하기 위한 전략을 세울 수 있습니다.
- 위험 관리: 맥킨지 매트릭스를 통해 기업은 위험을 최소화하고 수익을 최적화하는 방안을 모색할 수 있습니다.
4. 결론
맥킨지 매트릭스는 시장 매력도와 경쟁력을 기준으로 사업 부문의 우선순위를 정하는 데 도움을 주는 강력한 도구입니다. 이를 통해 기업은 효율적인 자원 배분과 경쟁력 있는 전략 개발을 할 수 있으며, 장기적인 성장을 도모할 수 있습니다.
McKinsey Matrix is a tool used to evaluate business portfolios to aid in corporate strategy and investment decisions. Developed by the consulting team at McKinsey & Company, this matrix is also known as the GE/McKinsey Portfolio Analysis Model. It is used to assess the attractiveness of a market and the competitive strength of business units to efficiently allocate resources and make strategic decisions.
1. Concept of the McKinsey Matrix
The McKinsey Matrix is a two-dimensional matrix composed of 9 cells (3x3 grid). Each axis represents the following:
- Market Attractiveness: This axis evaluates the attractiveness of the market in which the business operates. It can include various factors such as market growth rate, market size, competitive intensity, regulatory environment, and more.
- Competitive Strength of Business Units: This axis assesses how strong each business unit is within the competitive market. It is measured by factors such as market share, product differentiation, brand image, technological capability, and other competitive advantages.
2. Nine Areas of the McKinsey Matrix
The McKinsey Matrix is divided into a 3x3 grid, with each cell representing a specific combination of market attractiveness and competitive strength:
(1) High Market Attractiveness & High Competitive Strength (Top Right Area)
Business units in this area are promising and highly competitive. The key strategy here is growth, expanding market presence, and investing more resources to sustain growth.
- Strategy: Invest/Expand
- Example: Business units operating products or services with leading market competitiveness.
(2) High Market Attractiveness & Low Competitive Strength (Top Central Area)
This area represents business units with high market attractiveness but low competitive strength. These units have growth potential but lack competitiveness, requiring efficient resource allocation. Generally, strategies for improving competitiveness should be adopted.
- Strategy: Invest to improve
- Example: Product lines entering a promising market but with low market share or brand recognition.
(3) High Market Attractiveness & Very Low Competitive Strength (Top Left Area)
Business units in this area operate in attractive markets but have very low competitiveness. In this case, divestment or resource reallocation might be necessary.
- Strategy: Divest/Exit
- Example: Business units falling behind in competition despite market growth potential.
(4) Medium Market Attractiveness & High Competitive Strength (Middle Right Area)
This business unit is competitive but operates in a market with low growth potential. The goal here may be to maximize profits, focusing on cost reduction and efficiency improvements.
- Strategy: Harvest/Optimize
- Example: Business units maintaining competitiveness in a stable market.
(5) Medium Market Attractiveness & Medium Competitive Strength (Middle Central Area)
This area includes business units with no significant growth potential and average competitiveness. Resources should be allocated carefully, and decisions should be made to either enhance competitiveness or exit the market.
- Strategy: Maintain or Improve
- Example: Business units with moderate competitiveness in markets with low growth potential.
(6) Medium Market Attractiveness & Low Competitive Strength (Middle Left Area)
This business unit operates in a market with low growth potential and has low competitiveness. Resource reallocation or divestment might be necessary.
- Strategy: Divest/Exit
- Example: Business units with products or services falling behind in competition.
(7) Low Market Attractiveness & High Competitive Strength (Bottom Right Area)
Business units in this area have low market attractiveness but relatively high competitiveness. Strategies to maximize profits are necessary, focusing on seeking stable revenue.
- Strategy: Harvest
- Example: Products or services with strong competitiveness in mature markets.
(8) Low Market Attractiveness & Medium Competitive Strength (Bottom Central Area)
This business unit operates in unattractive markets with medium competitiveness. Gradual downsizing or strategic reorientation might be required instead of aggressive investment.
- Strategy: Maintain or Reduce
- Example: Business units with average competitiveness in low-growth markets.
(9) Low Market Attractiveness & Low Competitive Strength (Bottom Left Area)
Business units in this area have low market attractiveness and low competitiveness. Generally, divestment or resource reallocation is necessary.
- Strategy: Divest/Exit
- Example: Business units with low potential for profitability.
3. Application of the McKinsey Matrix
The McKinsey Matrix is a valuable tool for companies to evaluate business portfolios and determine resource allocation strategies. Organizations can make strategic decisions considering market growth potential and competitiveness.
- Resource Allocation: Companies can use the matrix to prioritize resource allocation for each business unit.
- Competitiveness Analysis: Companies can objectively evaluate their competitiveness and develop strategies to strengthen advantages or improve weaknesses.
- Risk Management: The McKinsey Matrix helps companies minimize risks and optimize profits.
4. Conclusion
The McKinsey Matrix is a powerful tool that helps prioritize business units based on market attractiveness and competitiveness. It enables companies to efficiently allocate resources and develop competitive strategies, promoting long-term growth.
Chinese Translation
麦肯锡矩阵(McKinsey Matrix)是一种用于评估业务组合以帮助企业战略和投资决策的工具。由麦肯锡公司(McKinsey & Company)的咨询团队开发,这一矩阵也称为GE/麦肯锡业务组合分析模型。它用于评估市场的吸引力和业务单位的竞争力,以有效分配资源并做出战略决策。
1. 麦肯锡矩阵的概念
麦肯锡矩阵是一个由9个单元格(3x3网格)组成的二维矩阵。每个轴代表以下内容:
- 市场吸引力(Market Attractiveness):该轴评估业务所在市场的吸引力。它可以包括市场增长率、市场规模、竞争强度、监管环境等各种因素。
- 业务单位的竞争力(Competitive Strength of Business Units):该轴评估每个业务单位在竞争市场中的竞争力。通过市场份额、产品差异化、品牌形象、技术能力等竞争优势因素进行衡量。
2. 麦肯锡矩阵的九个区域
麦肯锡矩阵分为一个3x3网格,每个单元格代表市场吸引力和竞争力的特定组合:
(1) 高市场吸引力和高竞争力(右上区域)
这个区域的业务单位前景光明且竞争力强。这里的关键战略是增长,扩展市场份额并投入更多资源以持续增长。
- 策略:投资/扩展(Invest/Expand)
- 例子:运营在市场上具有领导竞争力的产品或服务的业务单位。
(2) 高市场吸引力和低竞争力(中上区域)
该区域表示市场吸引力高但竞争力低的业务单位。这些单位具有增长潜力,但竞争力不足,需要有效的资源分配。通常应采取提高竞争力的策略。
- 策略:投资以提高(Invest to improve)
- 例子:进入有前景市场但市场份额低或品牌认知度不足的产品线。
(3) 高市场吸引力和极低竞争力(左上区域)
这个区域的业务单位在吸引力市场运营,但竞争力极低。在这种情况下,可能需要撤资或资源重分配。
- 策略:撤资/退出(Divest/Exit)
- 例子:尽管市场增长潜力大但竞争中落后的业务单位。
(4) 中等市场吸引力和高竞争力(右中区域)
这个业务单位具有竞争力但市场增长潜力低。目标可能是最大化利润,重点关注降低成本和提高效率。
- 策略:收获/优化(Harvest/Optimize)
- 例子:在稳定市场中保持竞争力的业务单位。
(5) 中等市场吸引力和中等竞争力(中心区域)
该区域包括无显著增长潜力和竞争力一般的业务单位。应慎重分配资源,并决定是提高竞争力还是退出市场。
- 策略:维持或改进(Maintain or Improve)
- 例子:在增长潜力低的市场中具有中等竞争力的业务单位。
(6) 中等市场吸引力和低竞争力(左中区域)
这个业务单位运营在市场增长潜力低且竞争力低的市场。可能需要资源重分配或撤资。
- 策略:撤资/退出(Divest/Exit)
- 例子:竞争中落后的产品或服务的业务单位。